실무에서 자주 하는 중요한 과정이다.
(missing value 처리 -> outlier -> transformation -> featuring; 수식에 의해 새 컬럼 만드는 것 -> scaling;표준,정규화)
import pandas as pd
import seaborn as sns
import matplotlib.pyplot as plt
import numpy as np

titanic = sns.load_dataset("titanic")
titanic.info()   # 결측치 탐색
<class 'pandas.core.frame.DataFrame'>
RangeIndex: 891 entries, 0 to 890
Data columns (total 15 columns):
# Column Non-Null Count Dtype
--- ------ -------------- -----
0 survived 891 non-null int64
1 pclass 891 non-null int64
2 sex 891 non-null object
3 age 714 non-null float64
4 sibsp 891 non-null int64
5 parch 891 non-null int64
6 fare 891 non-null float64
7 embarked 889 non-null object
8 class 891 non-null category
9 who 891 non-null object
10 adult_male 891 non-null bool
11 deck 203 non-null category
12 embark_town 889 non-null object
13 alive 891 non-null object
14 alone 891 non-null bool
dtypes: bool(2), category(2), float64(2), int64(4), object(5)
memory usage: 80.7+ KB
titanic.isnull().sum() #결측치 탐색 2, embark town = 정박지survived 0
pclass 0
sex 0
age 177
sibsp 0
parch 0
fare 0
embarked 2
class 0
who 0
adult_male 0
deck 688
embark_town 2
alive 0
alone 0
dtype: int64
결측치 처리(범위 넘는 것는 dropna 하겠다.) 후 결측치 점검
titanic = titanic.dropna(thresh=int(len(titanic)/2), axis=1)
titanic.isnull().sum() # 결측치 재점검
survived 0
pclass 0
sex 0
age 177
sibsp 0
parch 0
fare 0
embarked 2
class 0
who 0
adult_male 0
embark_town 2
alive 0
alone 0
dtype: int64
titanic = titanic[titanic.embarked.notnull()] # not null인 것만
titanic.isnull().sum()
survived 0
pclass 0
sex 0
age 177
sibsp 0
parch 0
fare 0
embarked 0
class 0
who 0
adult_male 0
embark_town 0
alive 0
alone 0
dtype: int64
이제 age만 남았다. 밀도함수로 age 상태 확인.
plt.figure(figsize=(8, 8))
sns.distplot(titanic['age'])  # 이 함수는 곧 사라질 것임. histplot' 으로 바뀔 것.
plt.grid()
plt.show()
titanic.age.fillna(value = titanic.age.median(), inplace=True)
titanic.isnull().sum()
survived 0
pclass 0
sex 0
age 0
sibsp 0
parch 0
fare 0
embarked 0
class 0
who 0
adult_male 0
embark_town 0
alive 0
alone 0
dtype: int64
Outlier 처리하기
class_names = ['first', 'second', 'third']
plt.figure(figsize=(12,5))
for i in range(0,3):    # loop 몇 번 돌건지.
    plt.subplot(1,3,i+1)
    sns.distplot(titanic[titanic.pclass == (i + 1)]['fare'], axlabel = class_names[i])
plt.tight_layout()
plt.show()
plt.figure(figsize=(16, 6))
sns.boxplot(x = 'fare', y='class', orient='h', data=titanic)
plt.grid()
plt.show()
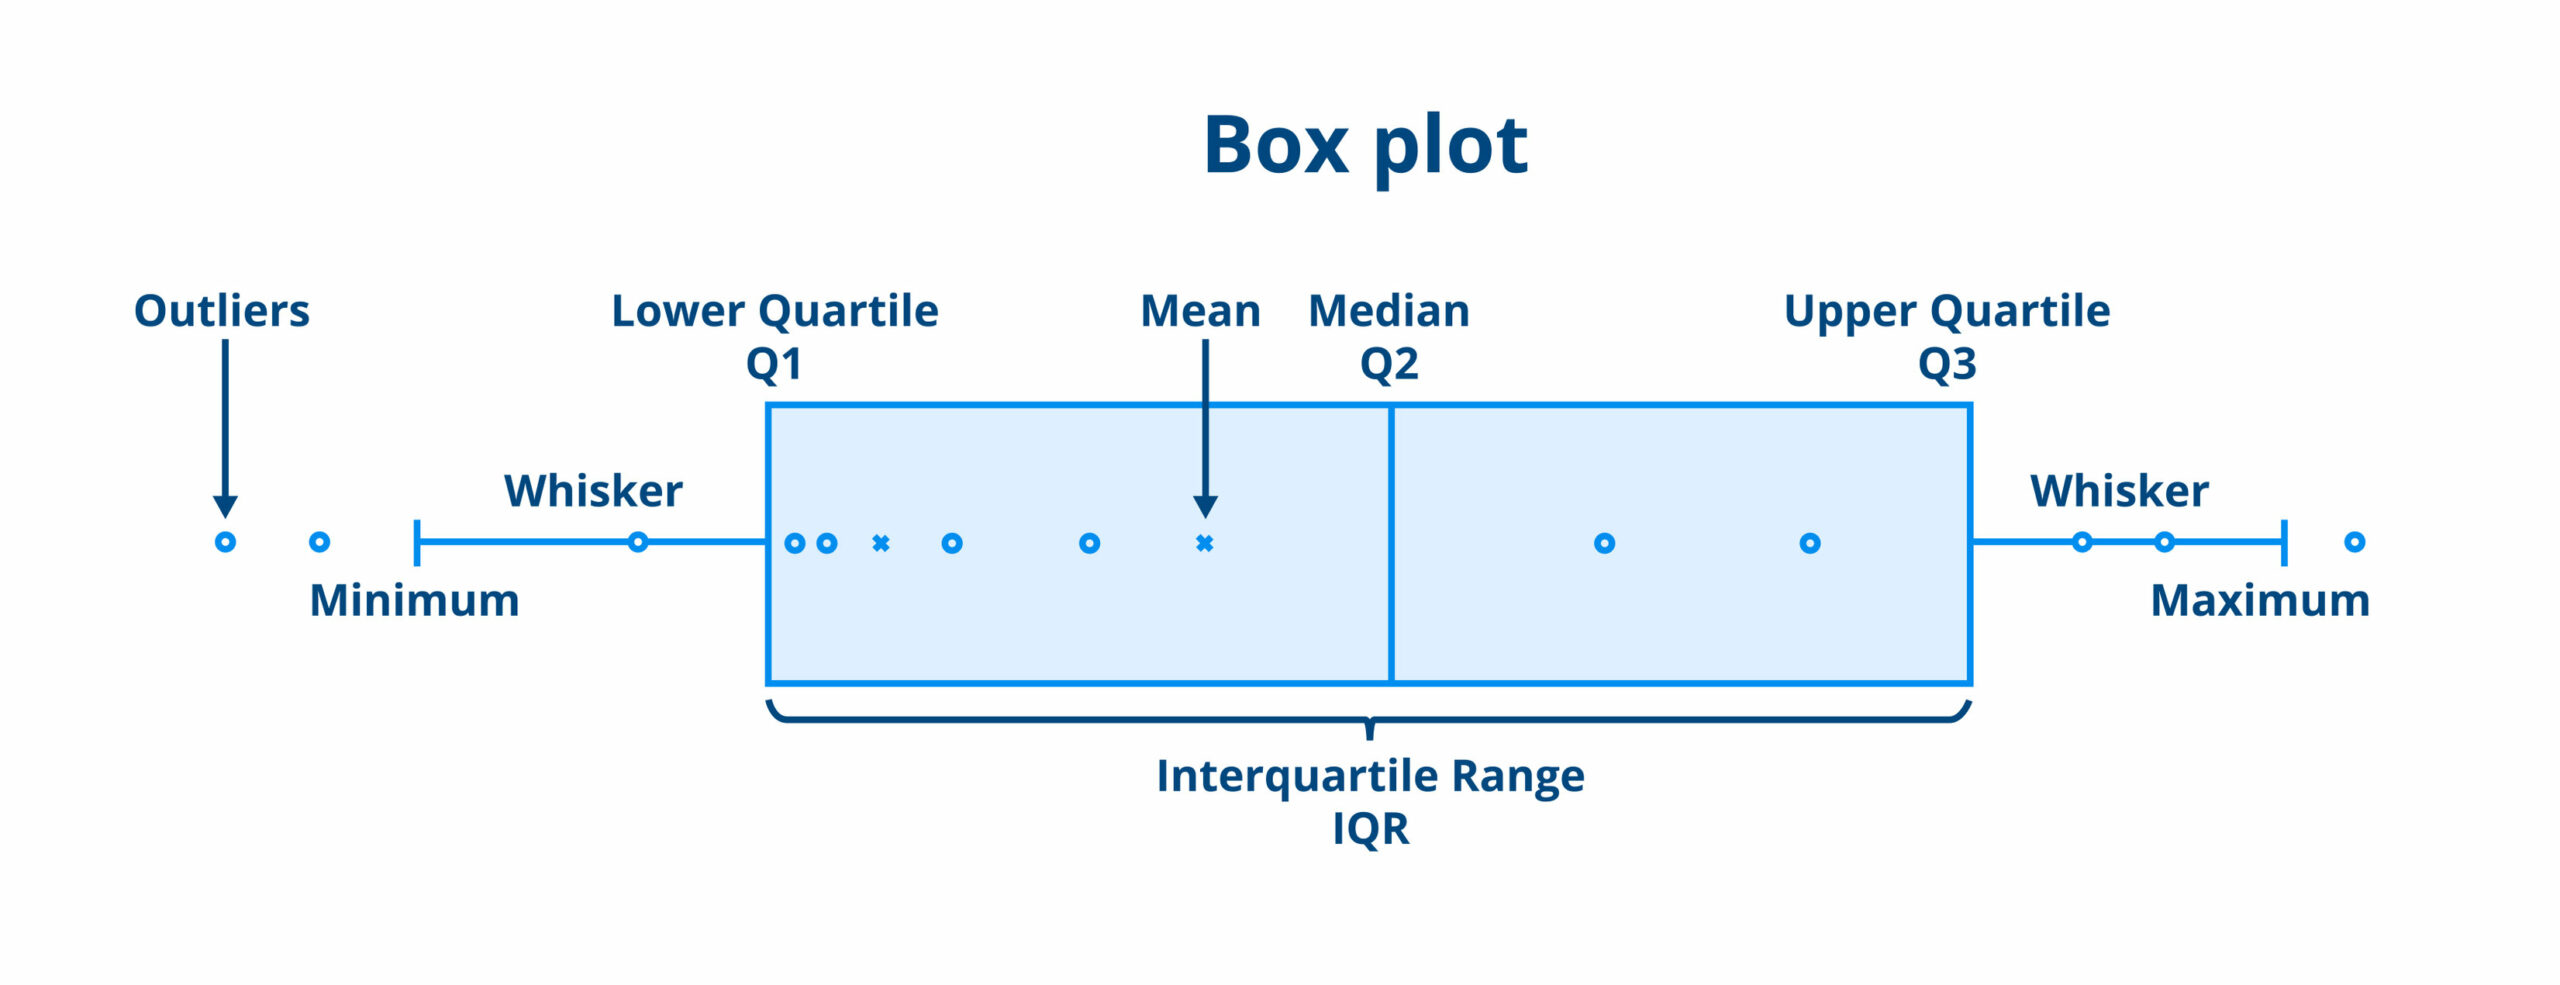
박스 밖의 것은 이상치일 수도 있는 것들 (확정은 아님)
plt.figure(figsize=(8, 6))
sns.catplot(x='class', y='fare', kind='swarm', data=titanic)
plt.grid()            #swarm = 부드럽게 그린다.
plt.show()
그래서 cat plot 그림

1st 와 2nd에 약간 동떨어져있는 부분 있음. 분류해서 확인해보자.

pd.DataFrame(titanic.fare.sort_values(ascending=False).head(10))
굉장히 많이 낸 사람들이 있다.
반대로 오름차순을 한다면?

pd.DataFrame(titanic.fare.sort_values(ascending=True).head(10))
아무것도 안 낸 사람들이 이리 많다고?
승무원(직원)이거나, 무임승차한 사람들일 것이다.
이상치를 일괄 조정하는 예제 (2번 데이터 카피해서 조정)
titanic2 = titanic.copy()
titanic2.loc[titanic2.fare > 512, 'fare'] = 263  # 일괄 조정
plt.figure(figsize=(8, 6))
sns.catplot(x='class', y='fare', kind='swarm', data=titanic2)
plt.grid()
plt.show() # 결과는?
아까보다 덜 한듯.
다른 처리방법 예제 (카피3)
titanic3 = titanic.copy()

def get_bound(series):
    quartile_1, quartile_3 = np.percentile(series, [25, 75]) #퍼센타일 벗어나는거 처리함수
    iqr = quartile_3 - quartile_1  #inter quartile range(iqr). boxplot 몸체부분
    lower_bound = quartile_1 - (iqr * 1.5)
    upper_bound = quartile_3 + (iqr * 1.5)  # 꼭 1.5를 곱할 필요는 없음. 그러나 1.5가 무난함
    return lower_bound, upper_bound

class_1 = titanic3[titanic3.pclass == 1]['fare']
class_2 = titanic3[titanic3.pclass == 2]['fare']   # 각각 클래스 데이터를 나누고
class_3 = titanic3[titanic3.pclass == 3]['fare']

class_1_lower, class_1_upper = get_bound(class_1)
class_2_lower, class_2_upper = get_bound(class_2)  # 함수 적용
class_3_lower, class_3_upper = get_bound(class_3)

titanic3.loc[(titanic3.pclass == 1) & (titanic3.fare < class_1_lower), 'fare'] = class_1_lower
titanic3.loc[(titanic3.pclass == 1) & (titanic3.fare > class_1_upper), 'fare'] = class_1_upper
titanic3.loc[(titanic3.pclass == 2) & (titanic3.fare < class_2_lower), 'fare'] = class_2_lower
titanic3.loc[(titanic3.pclass == 2) & (titanic3.fare > class_2_upper), 'fare'] = class_2_upper
titanic3.loc[(titanic3.pclass == 3) & (titanic3.fare < class_3_lower), 'fare'] = class_3_lower
titanic3.loc[(titanic3.pclass == 3) & (titanic3.fare > class_3_upper), 'fare'] = class_3_upper

plt.figure(figsize=(8, 6))
sns.catplot(x='class', y='fare', kind='swarm', data=titanic3)
plt.grid()
plt.show() # 결과 확인

lower and upper bound 지정해서 분배
다른 처리 방법 예제 4(카피4)
class_1_mean = titanic4[titanic4.pclass == 1]['fare'].mean()
class_2_mean = titanic4[titanic4.pclass == 2]['fare'].mean()
class_3_mean = titanic4[titanic4.pclass == 3]['fare'].mean()

titanic4 = titanic4[~((titanic4.pclass == 1) &    # ~ : 'not' 의미
           (np.abs(titanic4.fare - class_1_mean) > 3 * titanic4.fare.std()))]
# std = standard deviation(표준편차)
titanic4 = titanic4[~((titanic4.pclass == 2) &
           (np.abs(titanic4.fare - class_2_mean) > 3 * titanic4.fare.std()))]
titanic4 = titanic4[~((titanic4.pclass == 3) &
           (np.abs(titanic4.fare - class_3_mean) > 3 * titanic4.fare.std()))]
# 3s를 벗어나는 것을 이상치로 규정하겠다는 의미.


plt.figure(figsize=(8, 6))
sns.catplot(x='class', y='fare', kind='swarm', data=titanic4)
plt.grid()
plt.show()
plt.figure(figsize=(12,5))
for i in range(0,3):
    plt.subplot(1,3,i+1)
    sns.distplot(titanic4[titanic4.pclass == (i + 1)]['fare'], axlabel = class_names[i])
plt.tight_layout()
plt.show()
mode 최빈값
skew: 양수면 오른쪽으로 많이 치우쳐있다
kurtosis: 양수면 위로 뾰족한 정도가 높다.
print('skew : ', round(titanic.fare.skew(), 2))
print('kurtosis : ', round(titanic.fare.kurt(), 2))
skew : 4.79
kurtosis : 33.4
data transform
from sklearn import preprocessing

titanic['fare_log'] = preprocessing.scale(np.log(titanic.fare+1)) #log화 변환
draw_distplot('fare_log')                       #데이터 변환함수 scale
print('skew : ', round(titanic.fare_log.skew(), 2))
print('kurtosis : ', round(titanic.fare_log.kurt(), 2))
skew : 0.39
kurtosis : 0.98
현저히 줄어든 결과! (0을 중심으로 정규분포와 가까워짐!)
로그함수를 써야되는지 다른걸 써야되는지는 일일이 그래프 확인하면서 결정한 것.
선형회귀
from scipy import stats

fig = plt.figure(figsize = (12,8))

fig.add_subplot(1,2,1)
res = stats.probplot(titanic['fare'], plot=plt)

fig.add_subplot(1,2,2)
res = stats.probplot(titanic['fare_log'], plot=plt)
'Programming > Python' 카테고리의 다른 글
| 데이터 전처리3 (Correlation) (0) | 2023.09.05 |
|---|---|
| 데이터 전처리2 (Data Scaling) (0) | 2023.09.05 |
| [Matplotlib] 히트맵(pcolor) 및 응용 (0) | 2023.09.05 |
| [Matplotlib] 기본 (0) | 2023.09.04 |
| [Pandas] pivot_table, groupby로 데이터 통계 다루기 (0) | 2023.08.30 |


